 Mario Marcolongo
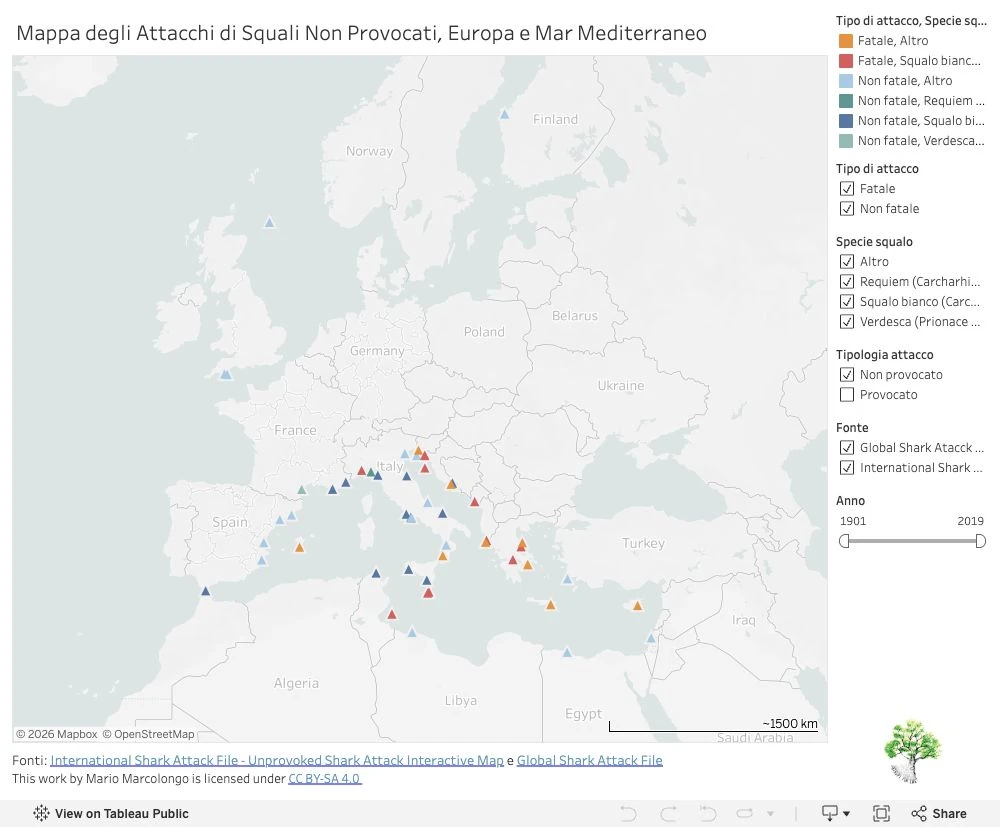
Entropy for Life · Tableau
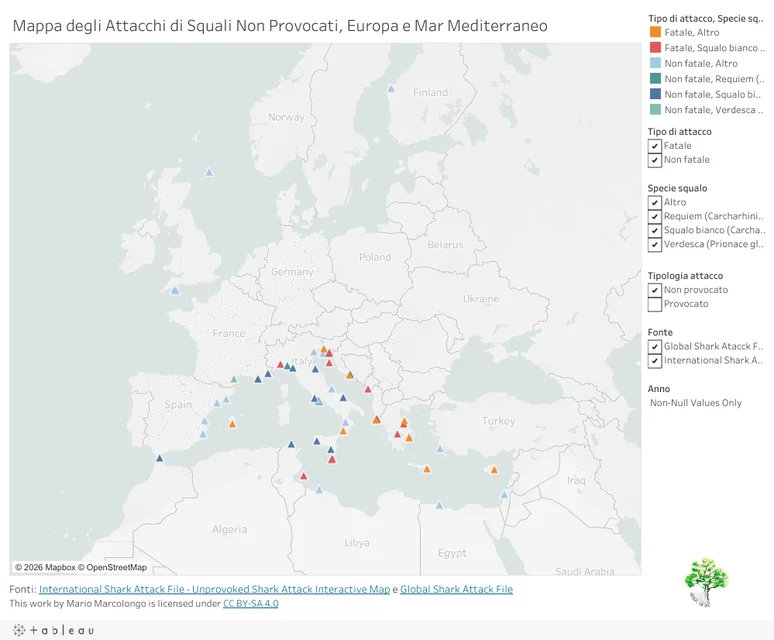
Mapping shark encounters
From source collection to an interactive map of shark attacks in Europe and the Mediterranean.
I turn source material into visual explanations you can explore. Browse the work, then open the original to inspect its data, sources and context.
A closer look
Source research. Visual explanation. Published work.
Entropy for Life · Tableau
From source collection to an interactive map of shark attacks in Europe and the Mediterranean.
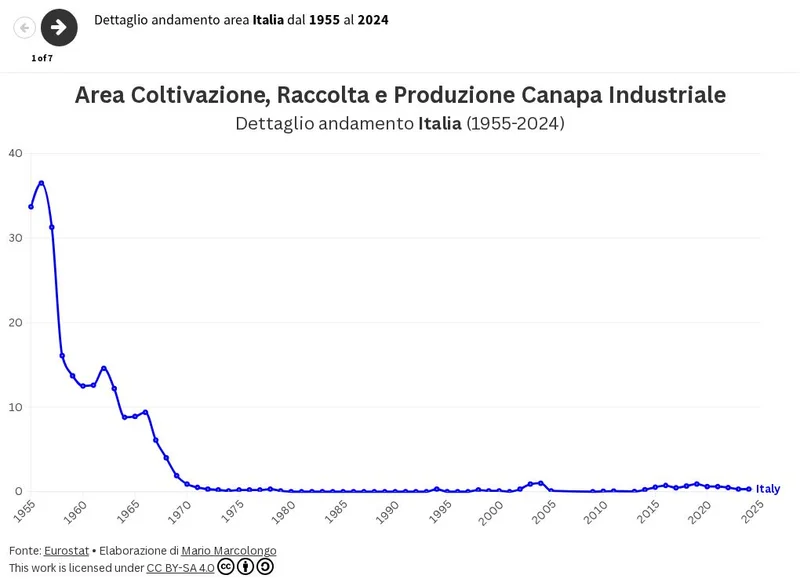
Eurostat data · Flourish
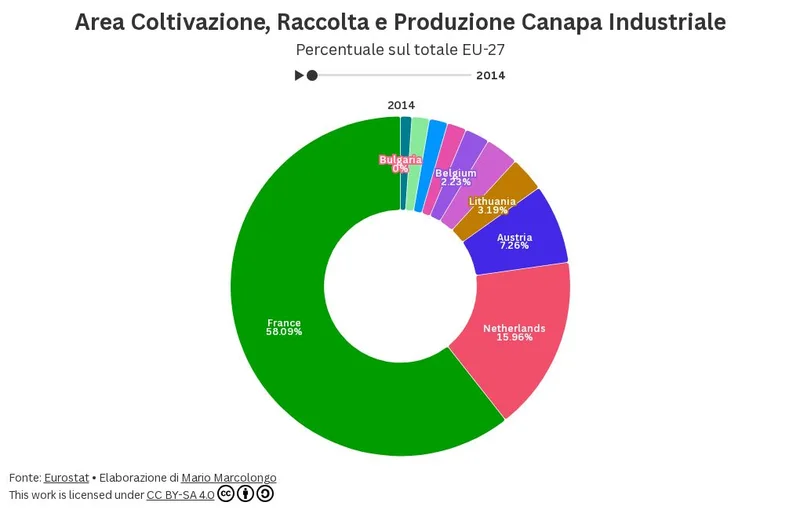
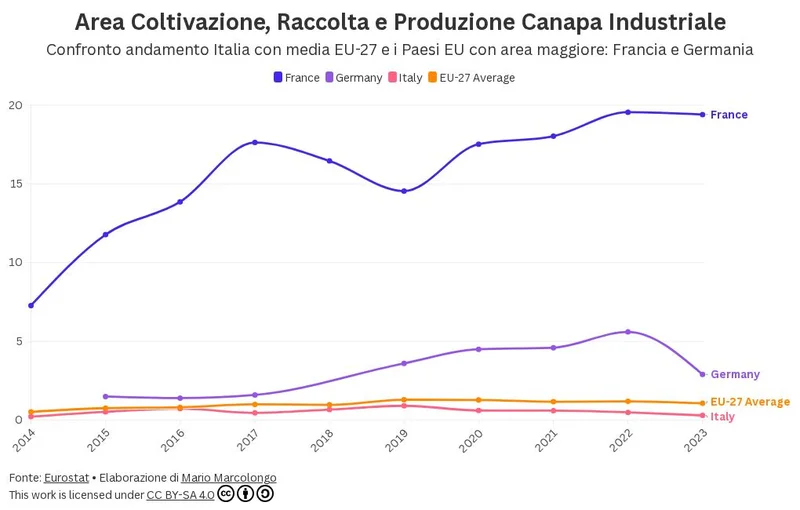
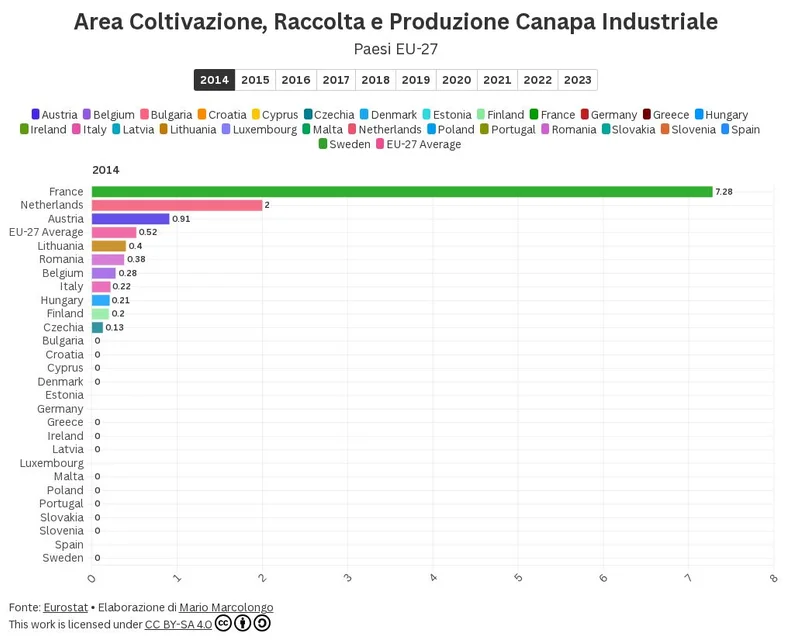
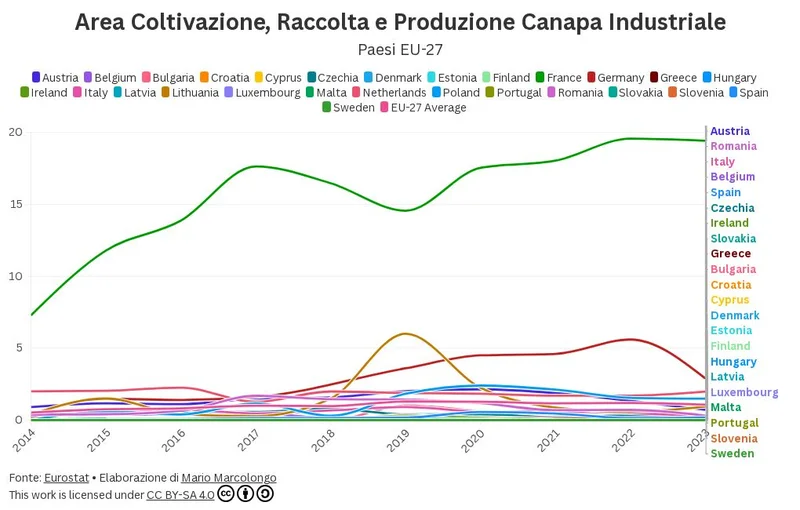
Seven linked views of cultivation, harvest and production, from European comparisons to Italian trends.

Biomedical diagram · Wikimedia Commons
My original vector diagram connects genes and overlapping clinical phenotypes, with references and a public reuse record.
Reused in a 2024 Palgrave Macmillan / Springer Nature book chapter and across four Wikipedia language editions.
The visual collection
73 published views · Previews of the originals
Includes alternate views and stories of related datasets. Each card opens the published original; these are not 73 separate assignments.
73 views
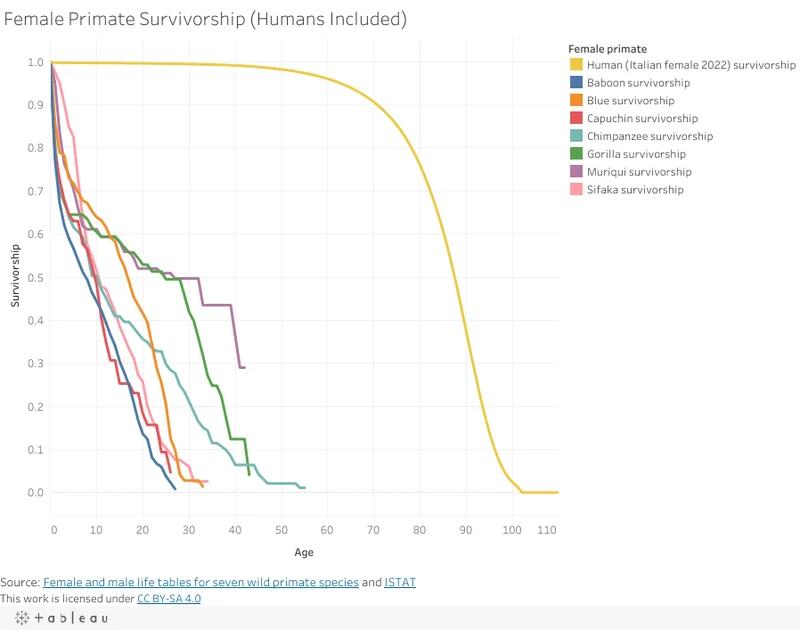 Interactive view
Open original
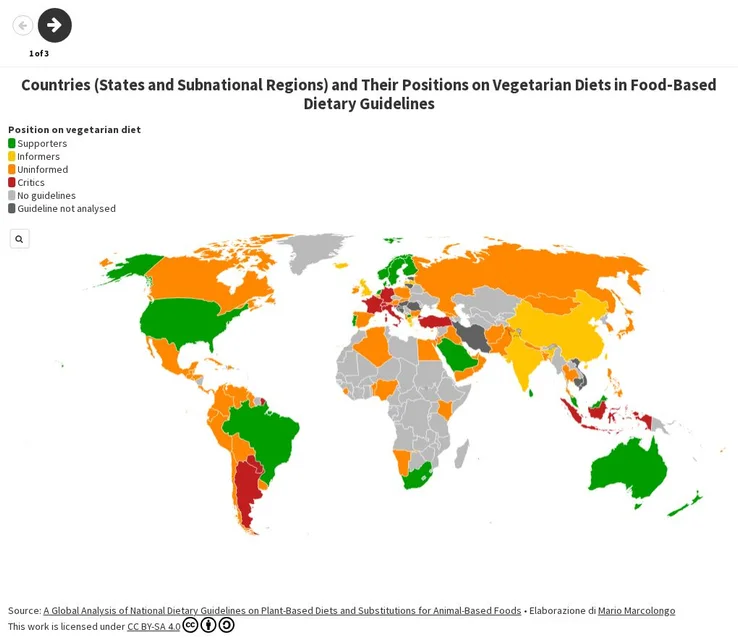 Story
Open original
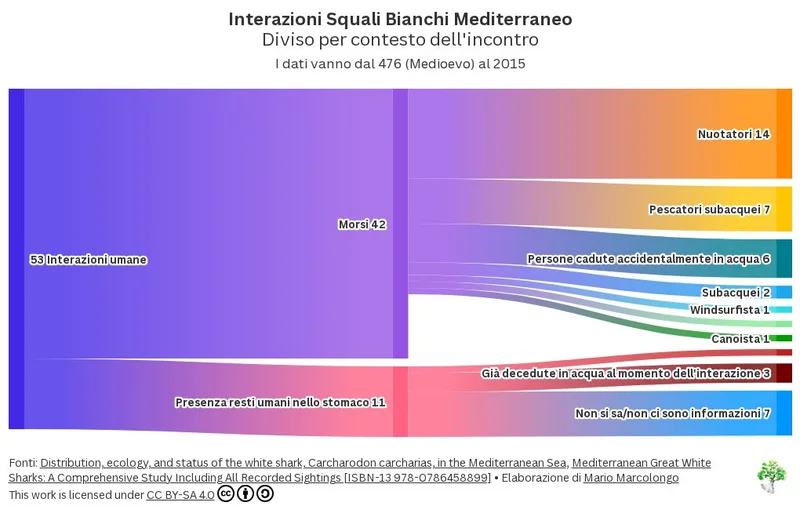 Interactive chart
Open original
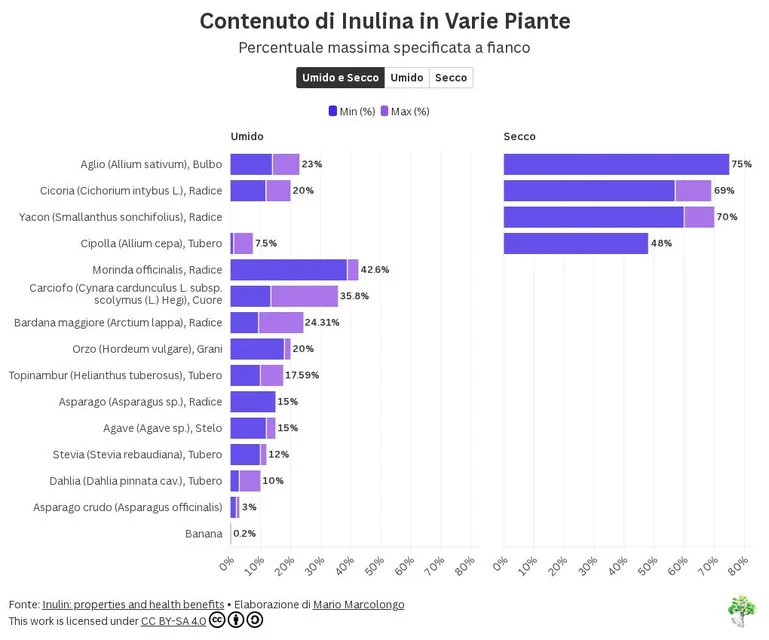 Interactive chart
Open original
 Diagram / map
Open original
 Diagram / map
Open original
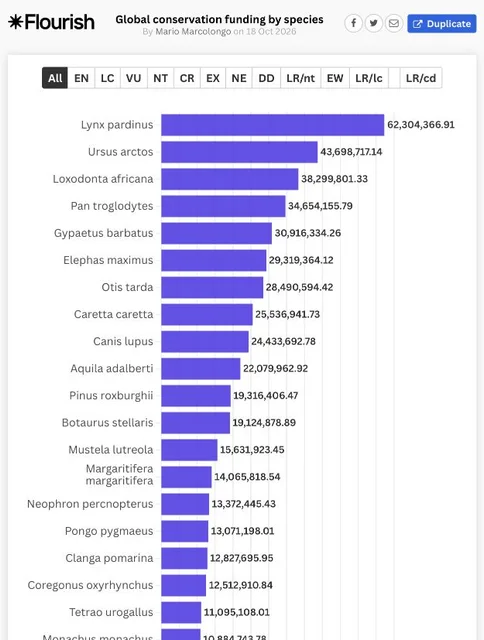 Interactive chart
Open original
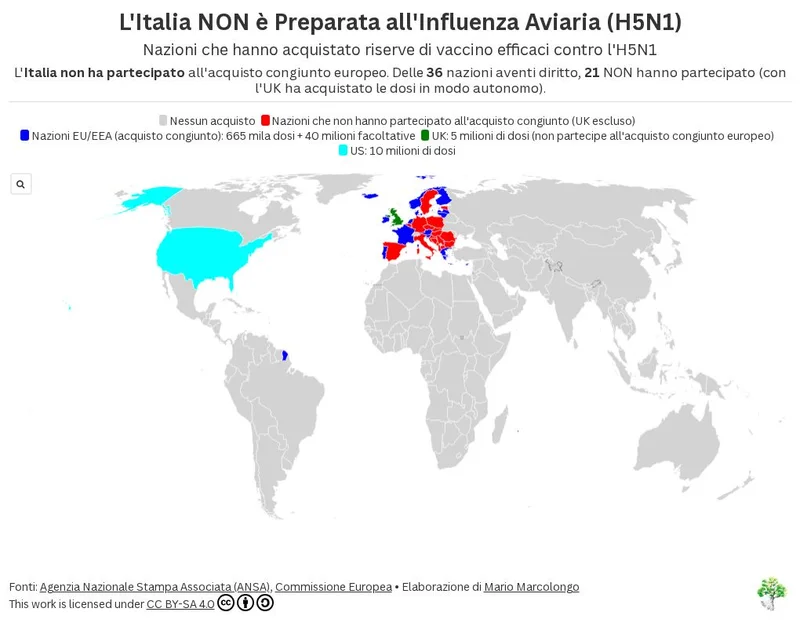 Interactive chart
Open original
StoryOpen original
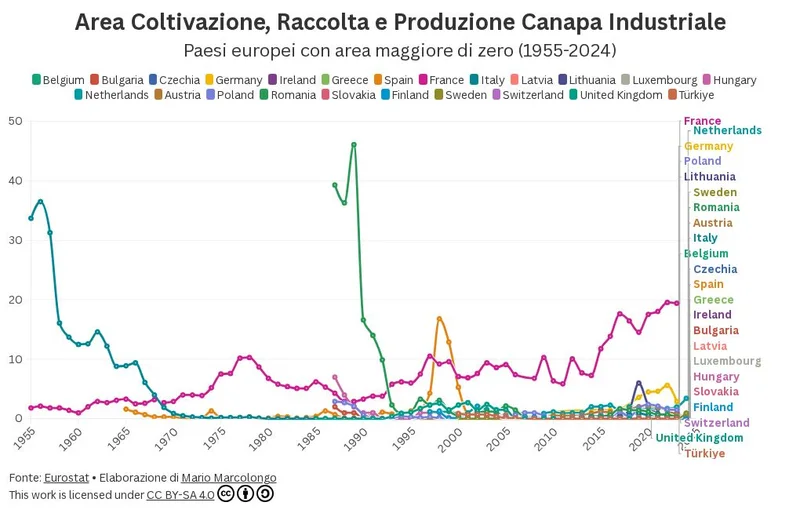 Interactive chart
Open original
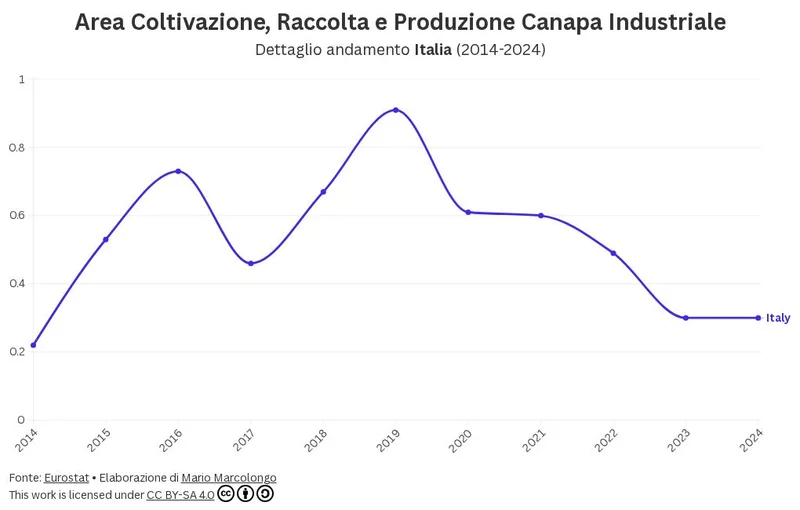 Interactive chart
Open original
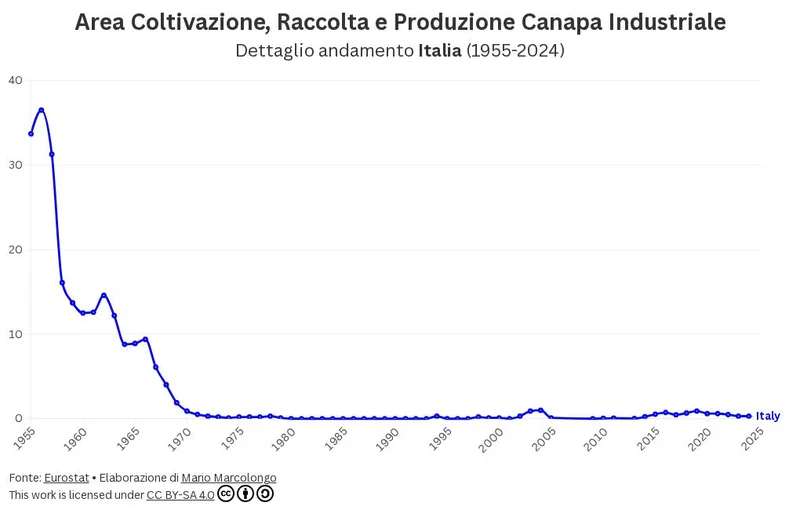 Interactive chart
Open original
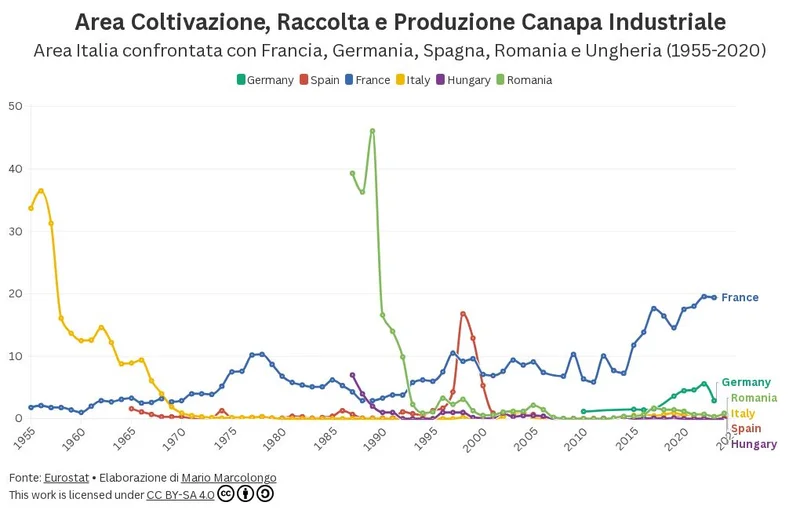 Interactive chart
Open original
 Interactive chart
Open original
 Interactive chart
Open original
 Interactive chart
Open original
 Interactive chart
Open original
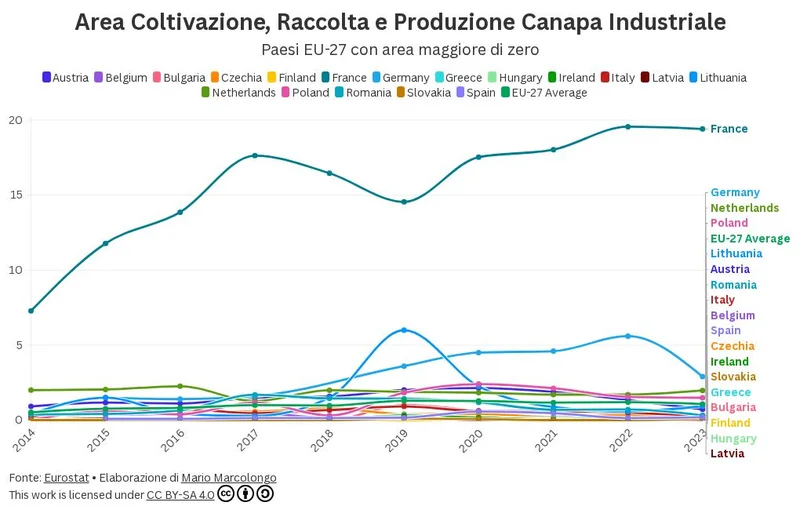 Interactive chart
Open original
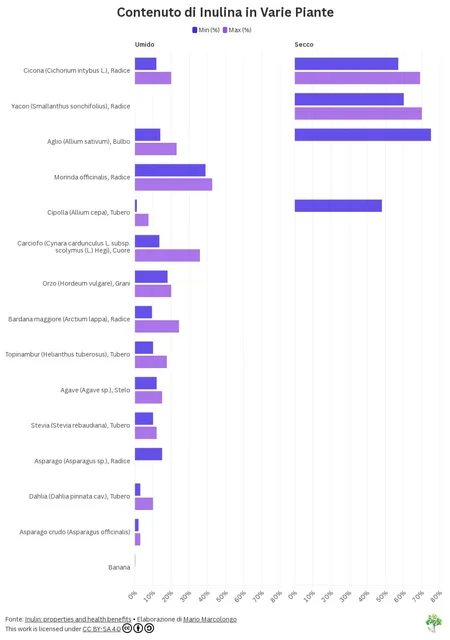 Interactive chart
Open original
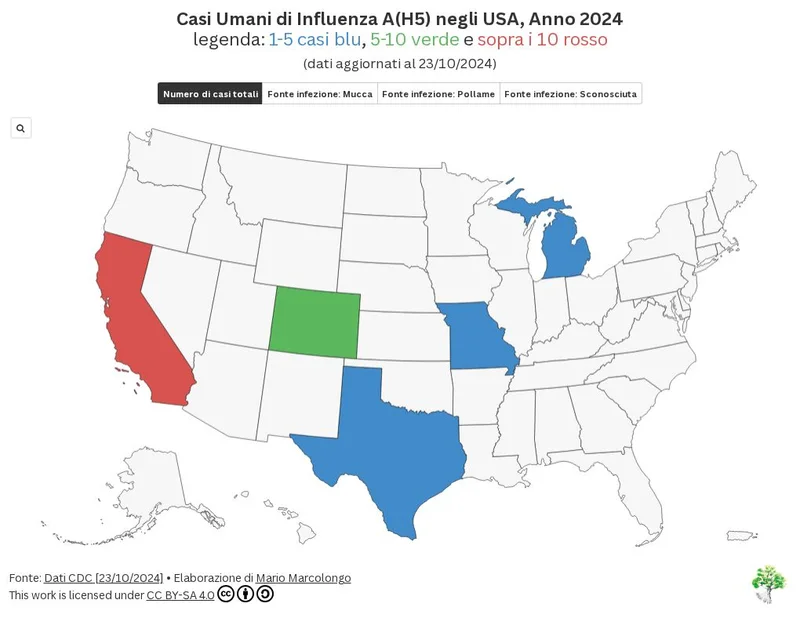 Interactive chart
Open original
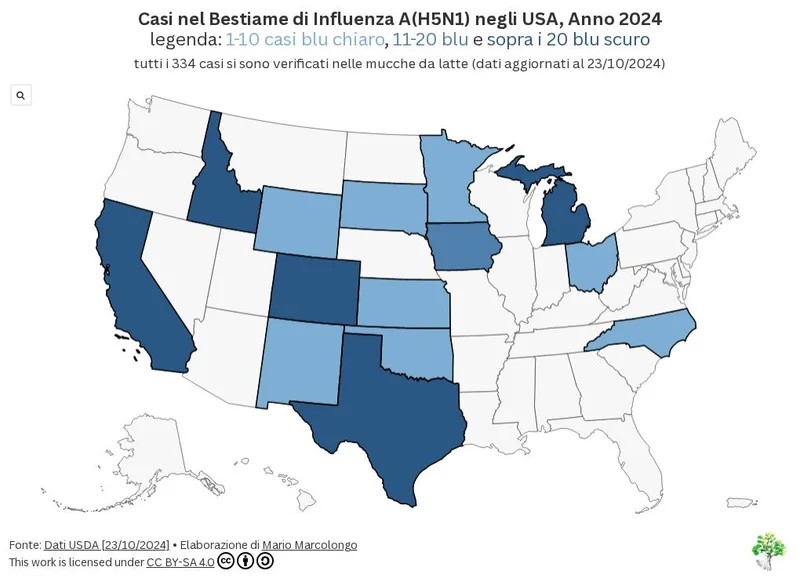 Interactive chart
Open original
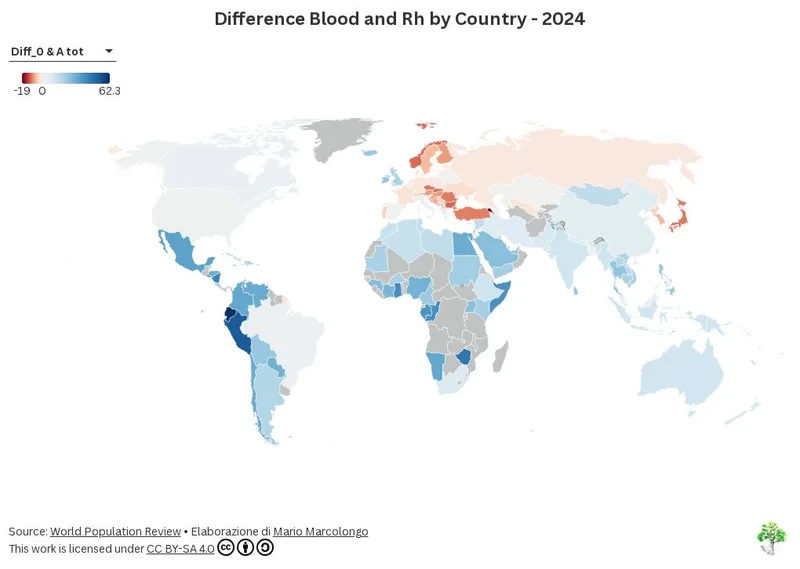 Interactive chart
Open original
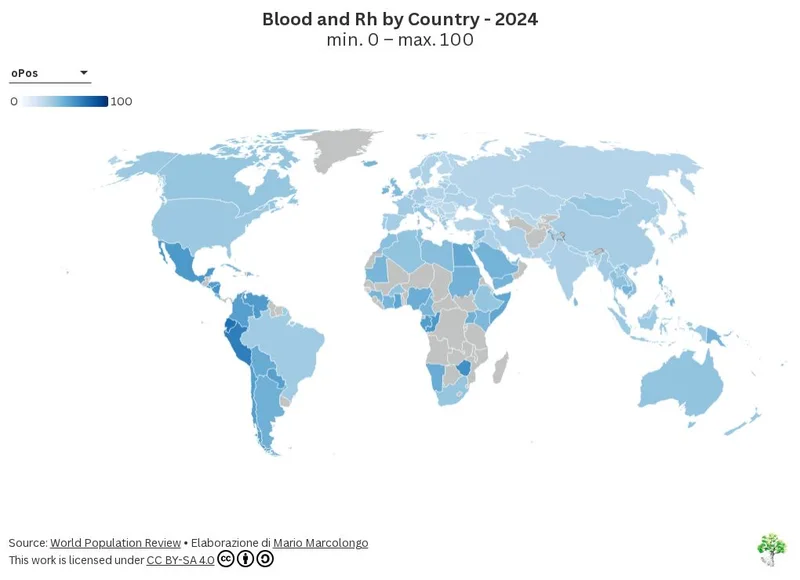 Interactive chart
Open original
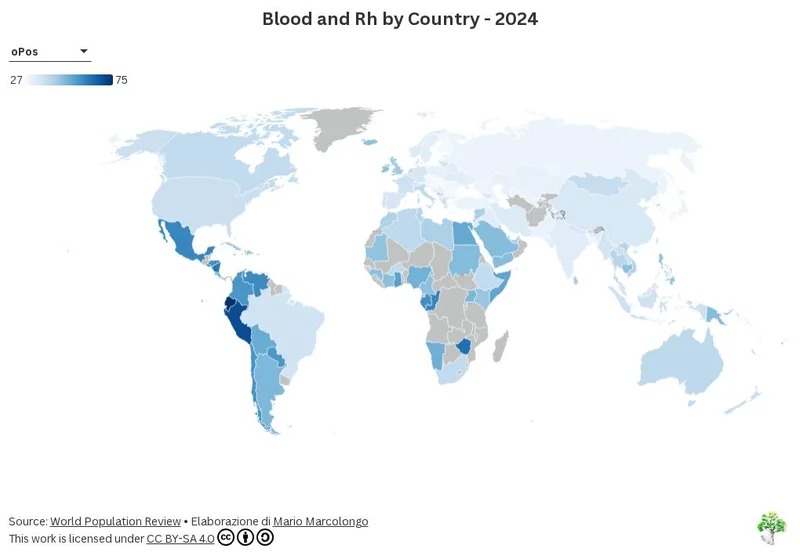 Interactive chart
Open original
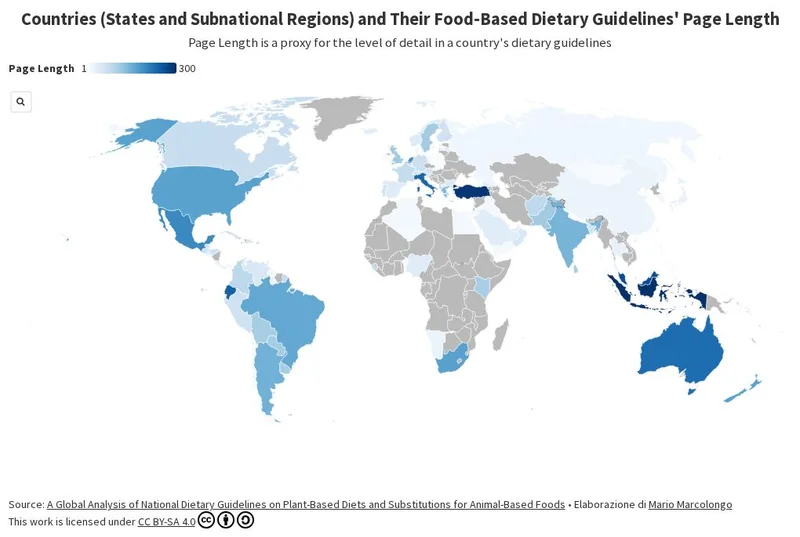 Interactive chart
Open original
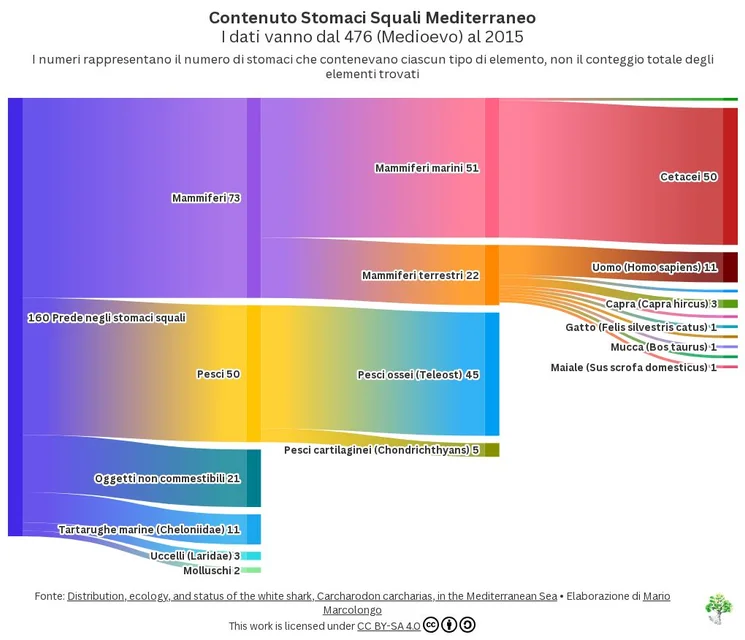 Interactive chart
Open original
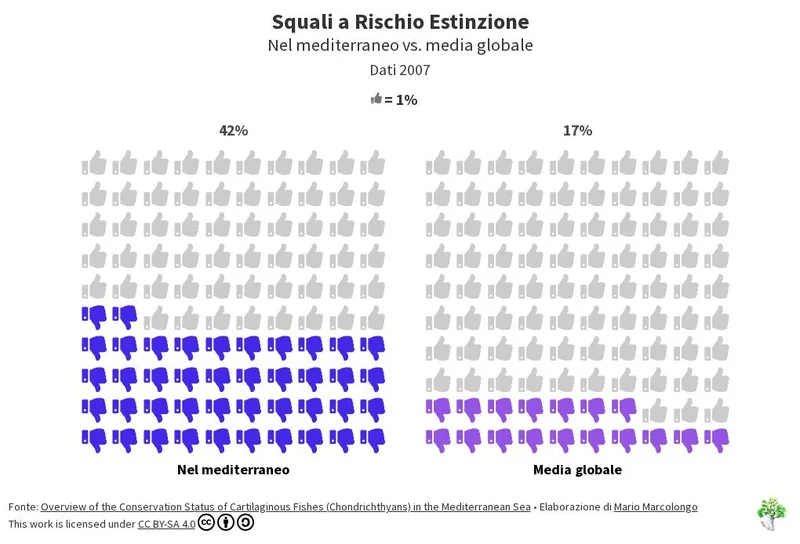 Interactive chart
Open original
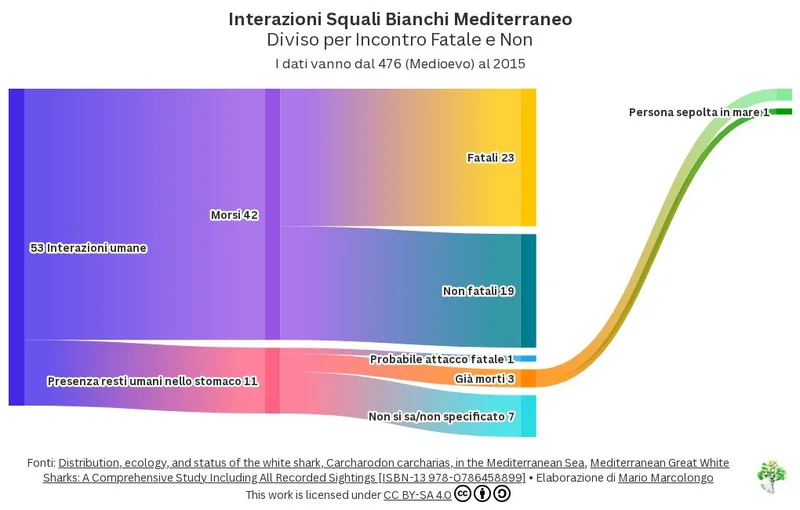 Interactive chart
Open original
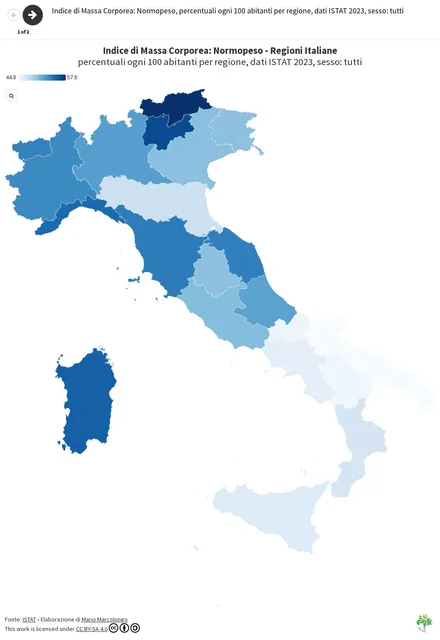 Story
Open original
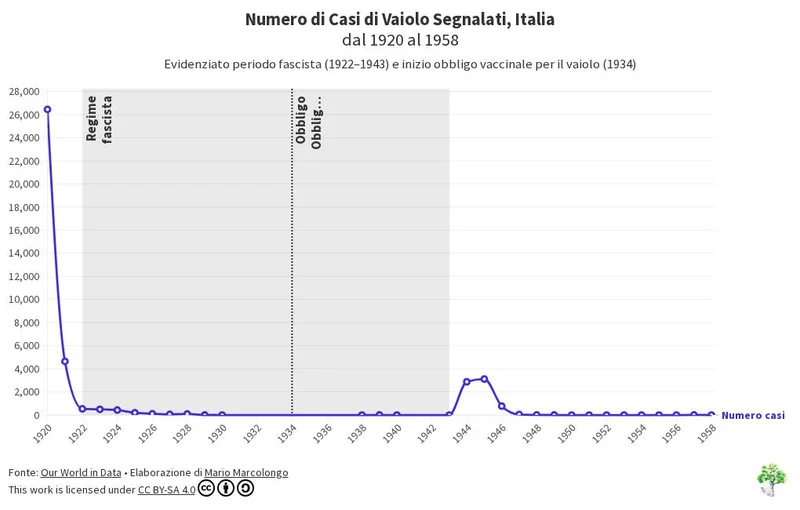 Interactive chart
Open original
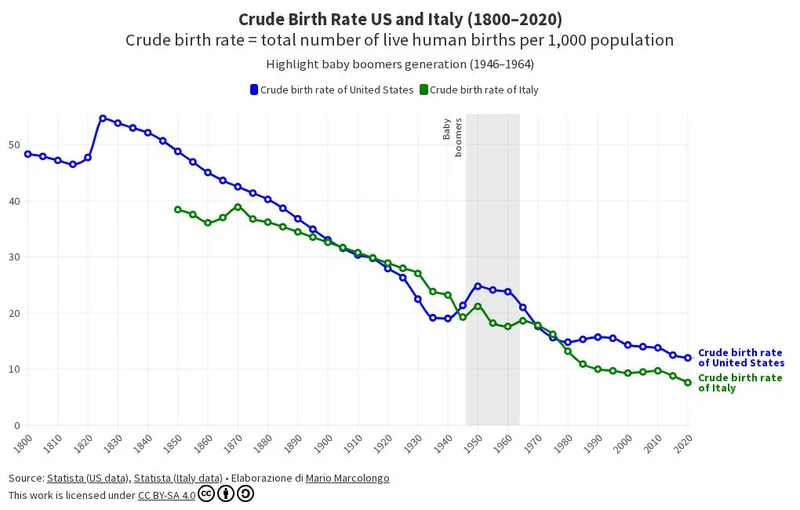 Interactive chart
Open original
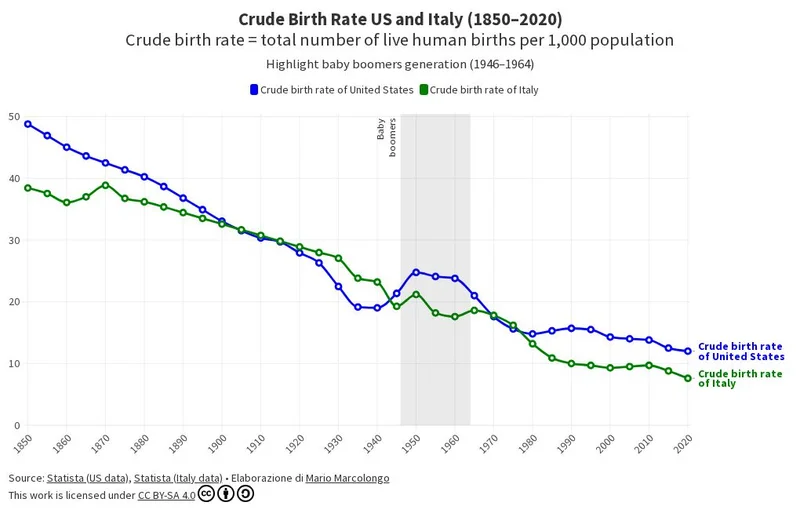 Interactive chart
Open original
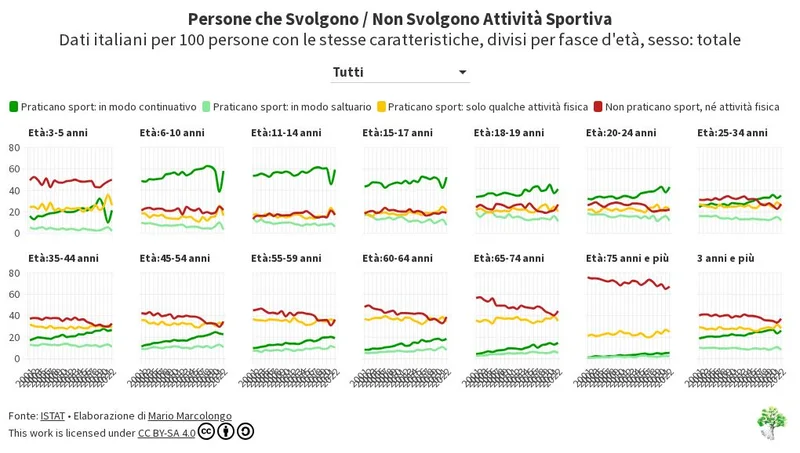 Interactive chart
Open original
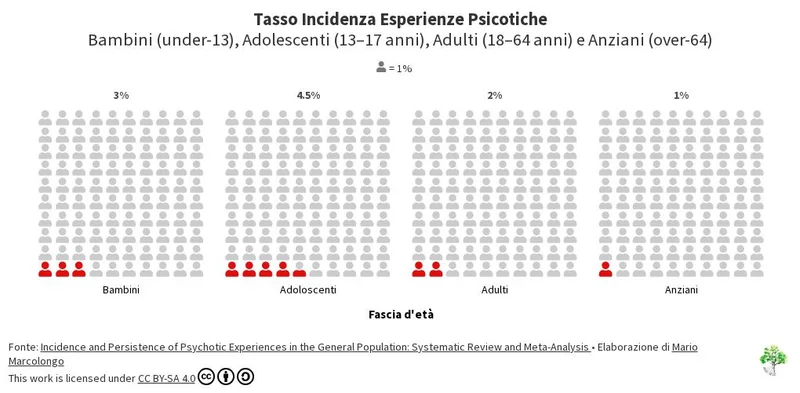 Interactive chart
Open original
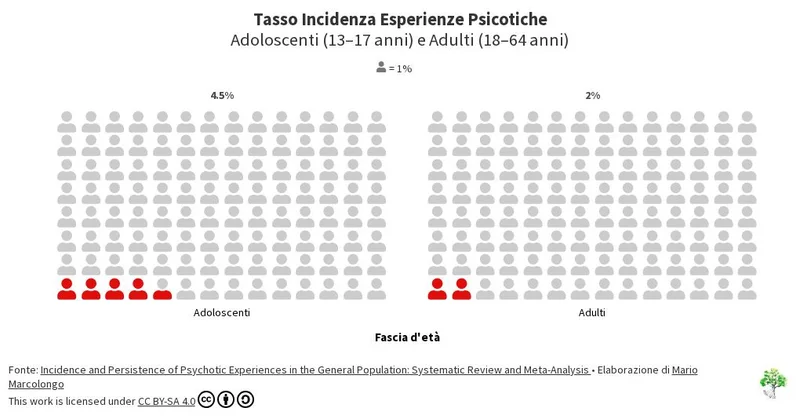 Interactive chart
Open original
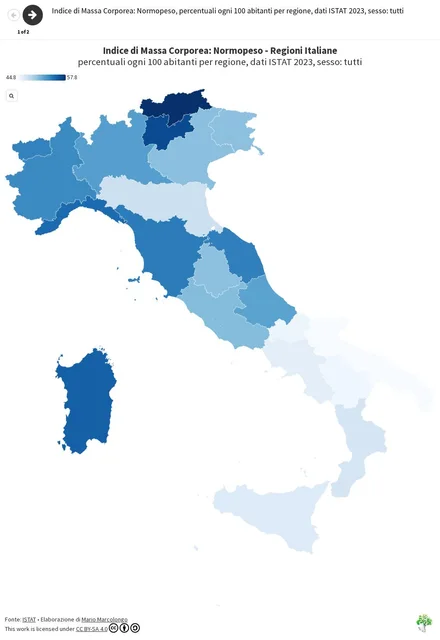 Story
Open original
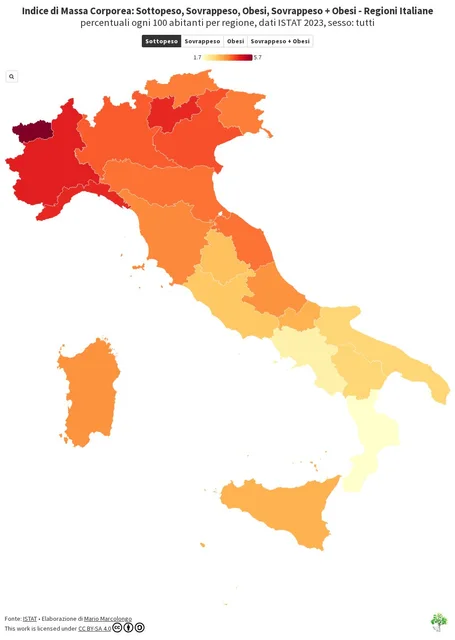 Interactive chart
Open original
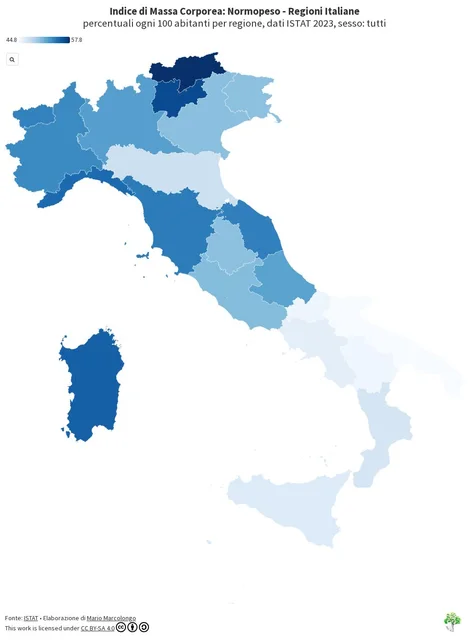 Interactive chart
Open original
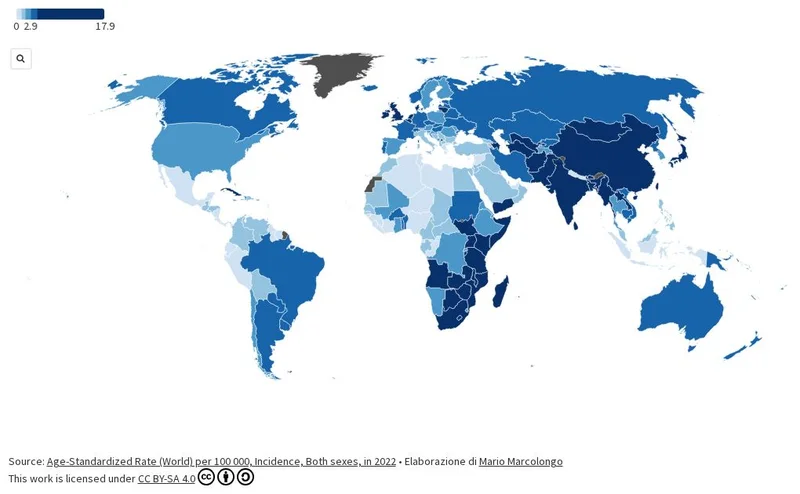 Interactive chart
Open original
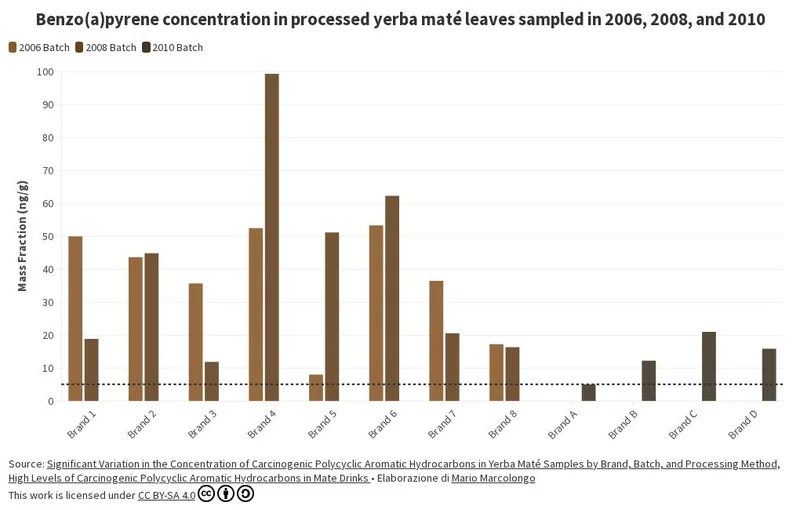 Interactive chart
Open original
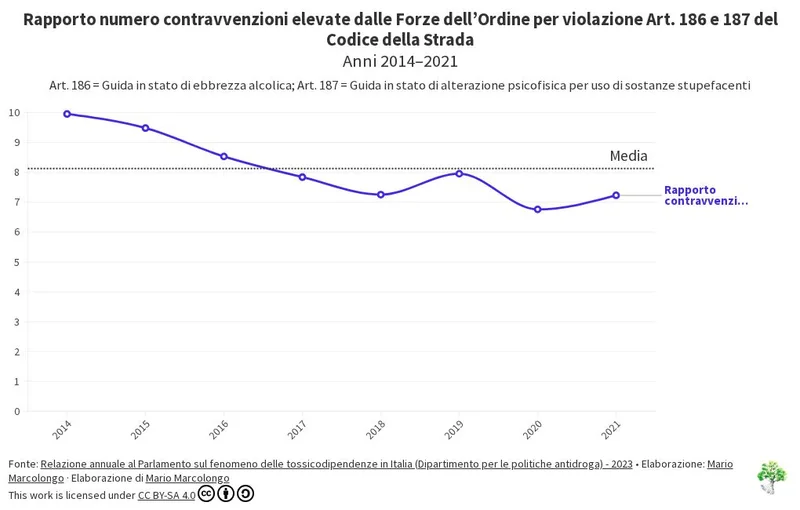 Interactive chart
Open original
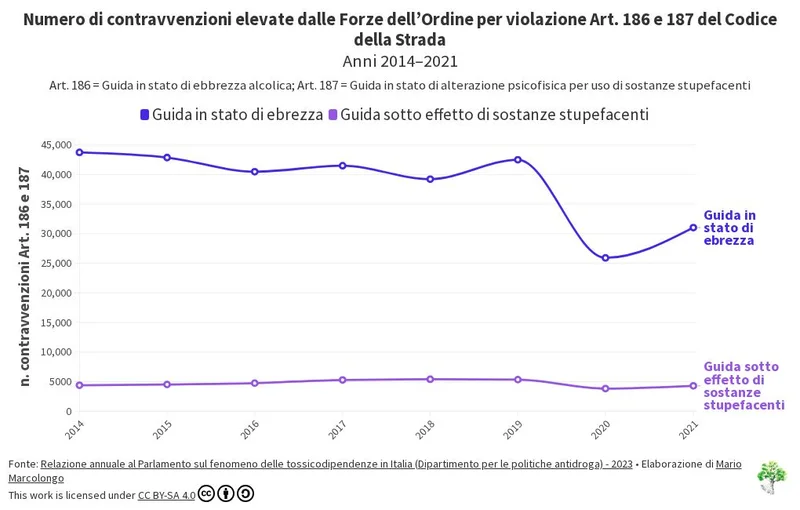 Interactive chart
Open original
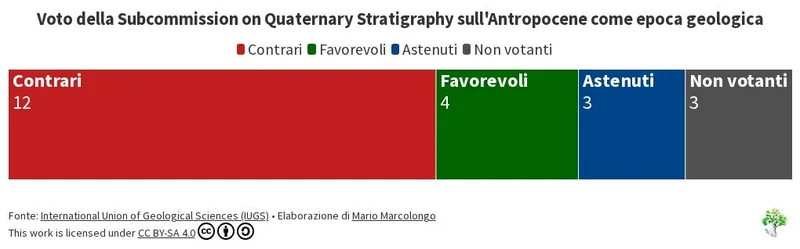 Interactive chart
Open original
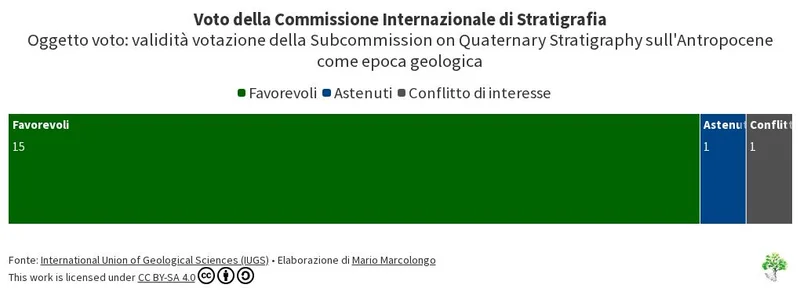 Interactive chart
Open original
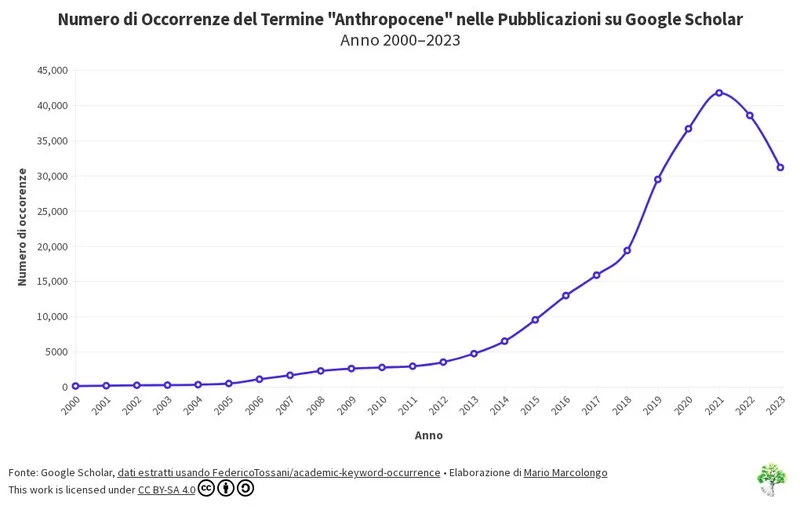 Interactive chart
Open original
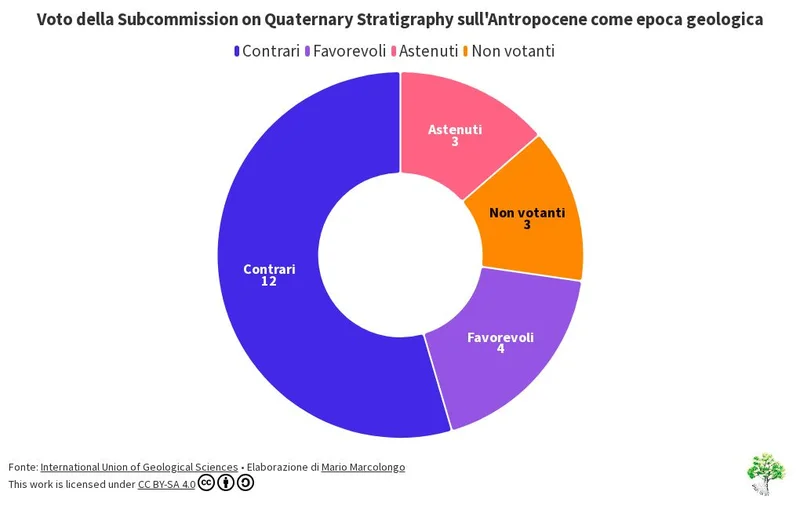 Interactive chart
Open original
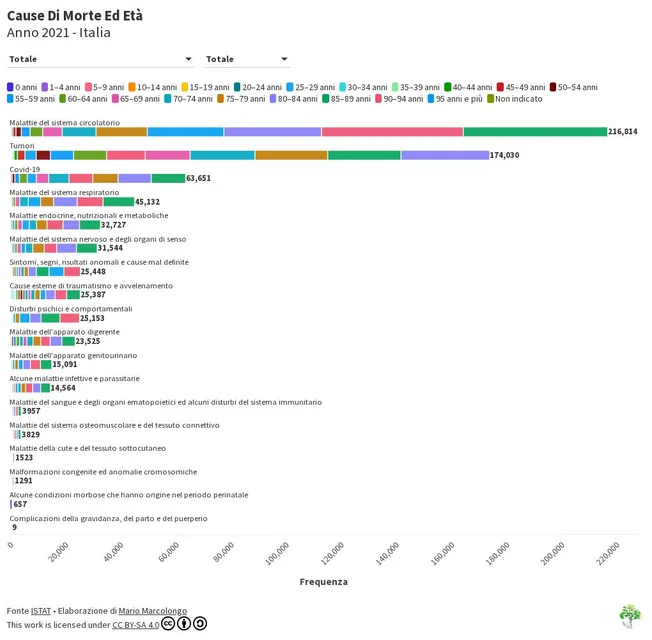 Interactive chart
Open original
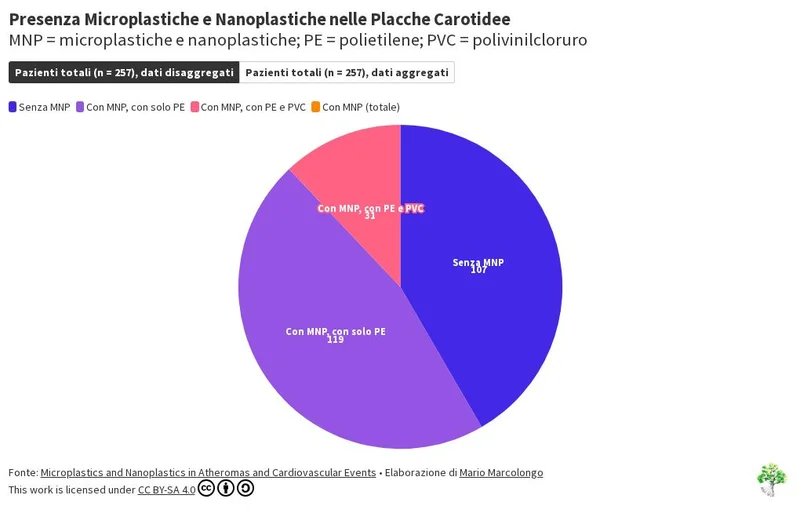 Interactive chart
Open original
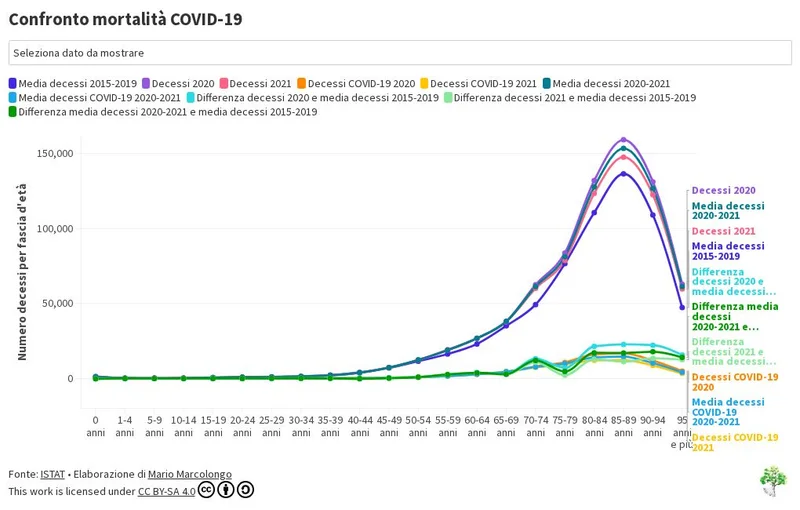 Interactive chart
Open original
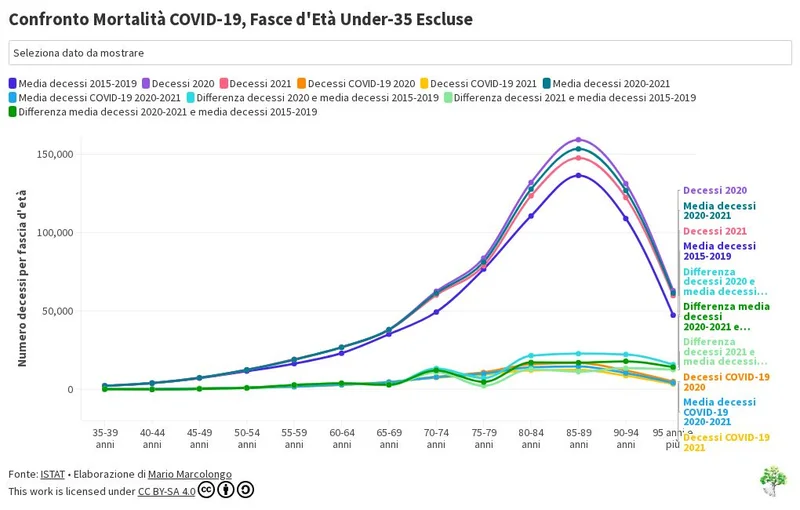 Interactive chart
Open original
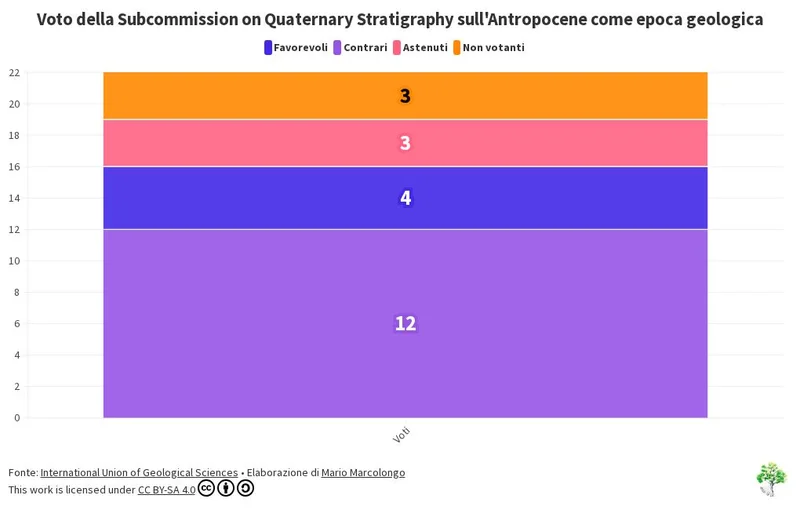 Interactive chart
Open original
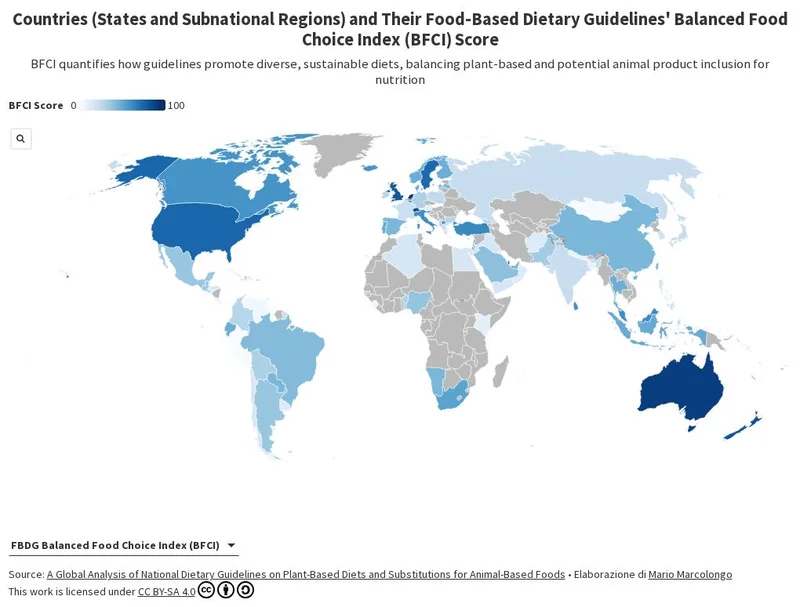 Interactive chart
Open original
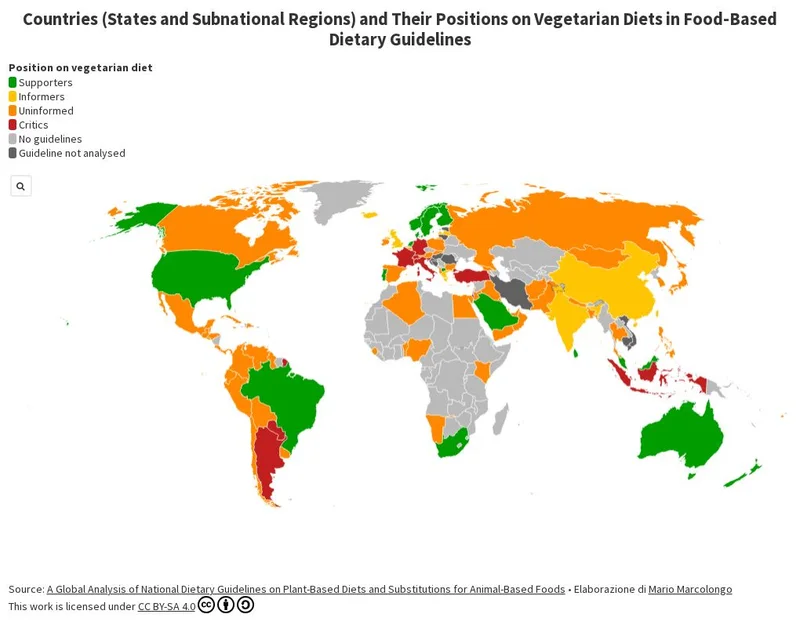 Interactive chart
Open original
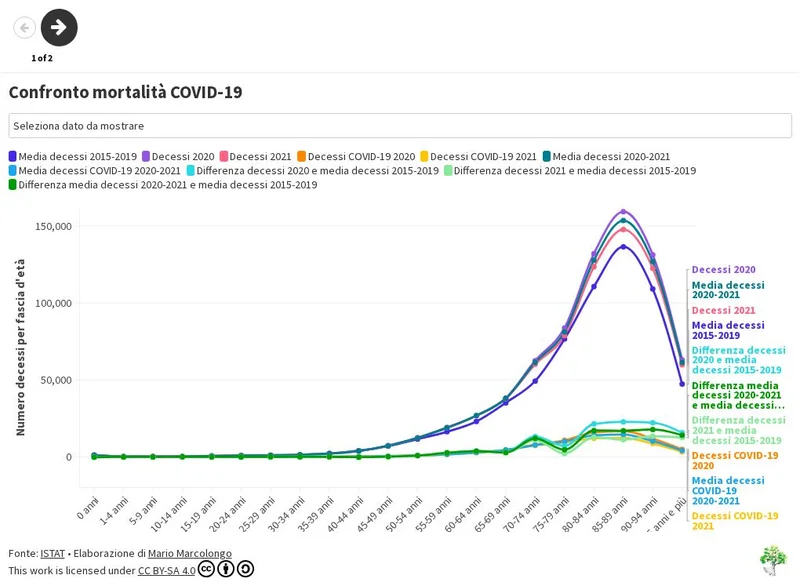 Story
Open original
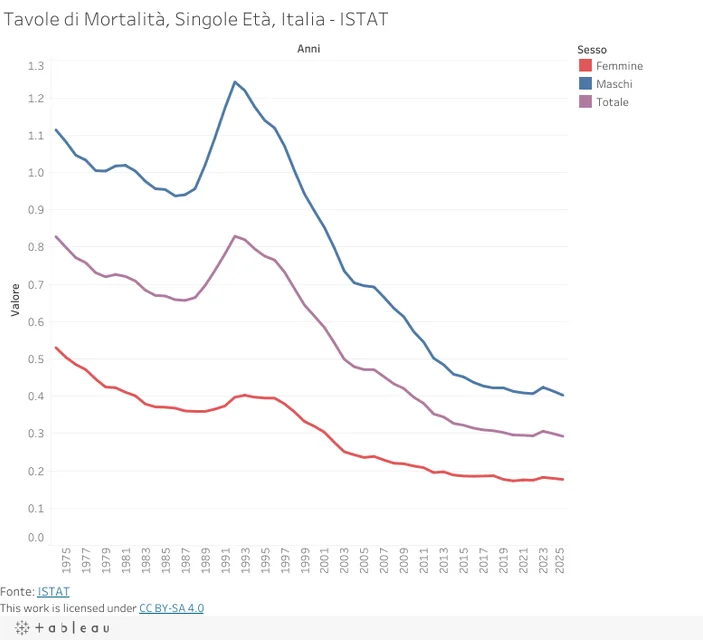 Interactive view
Open original
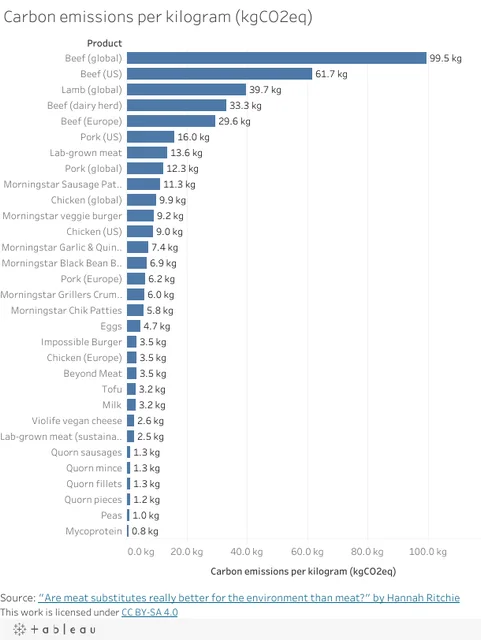 Interactive view
Open original
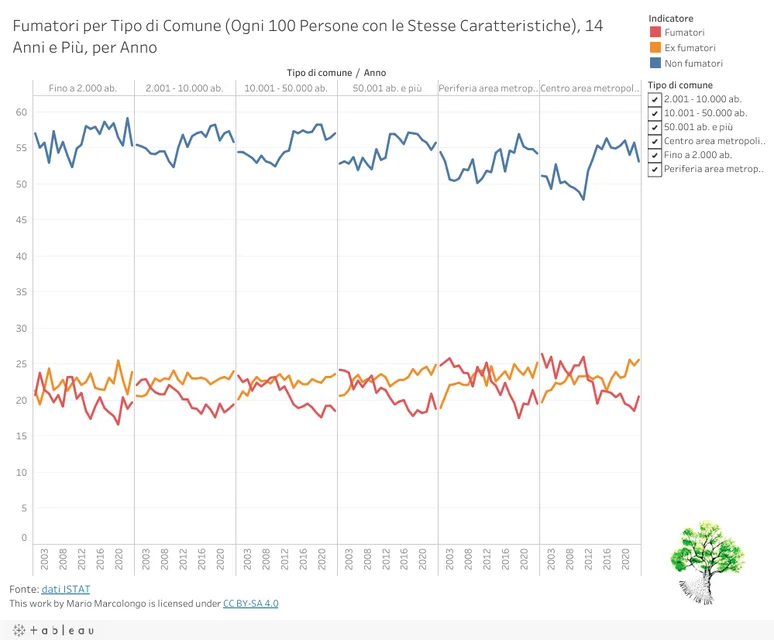 Interactive view
Open original
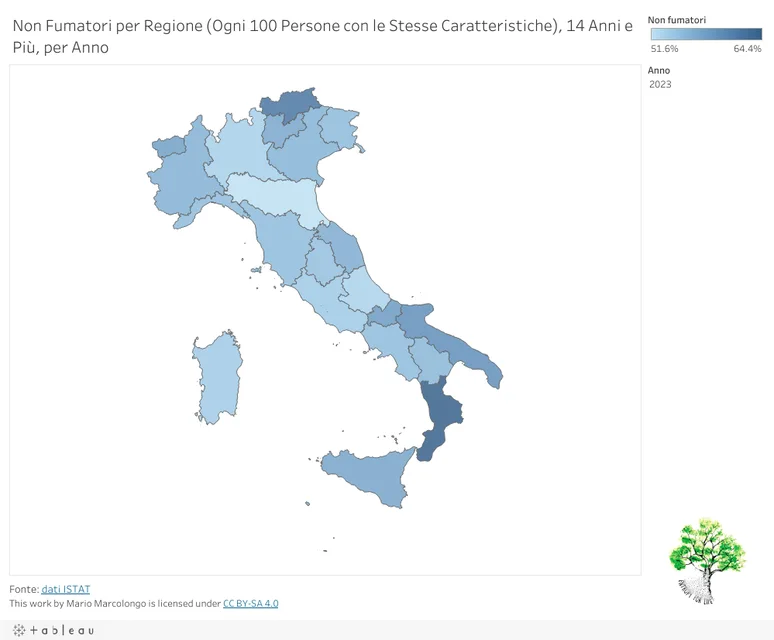 Interactive view
Open original
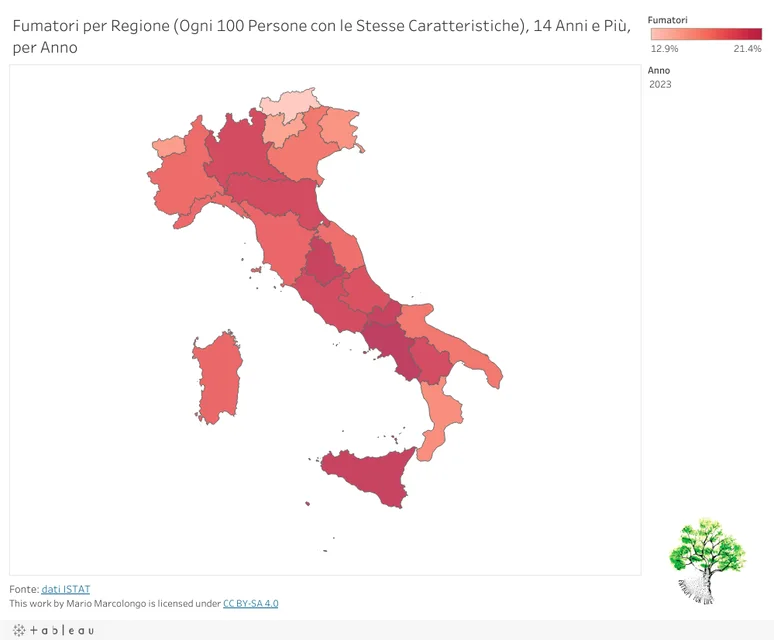 Interactive view
Open original
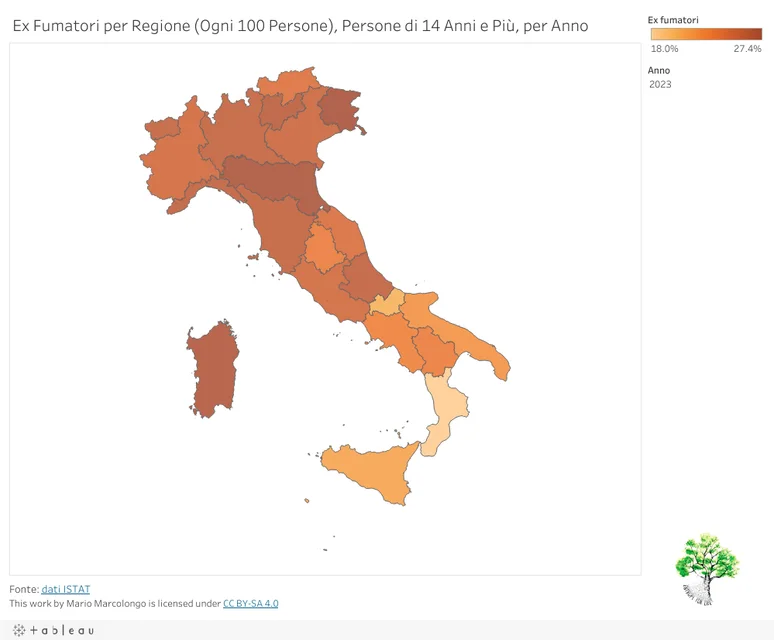 Interactive view
Open original
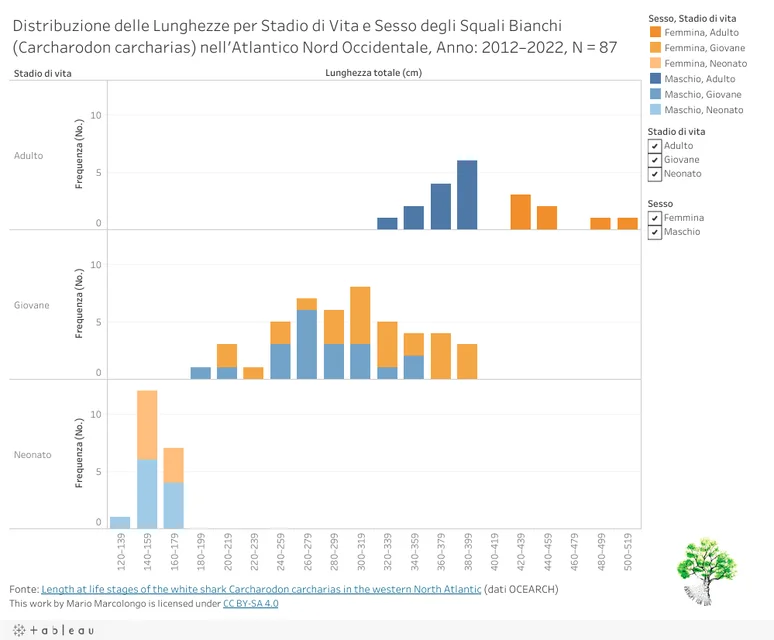 Interactive view
Open original
 Interactive view
Open original
 Interactive view
Open original
 Interactive view
Open original
 Interactive view
Open original
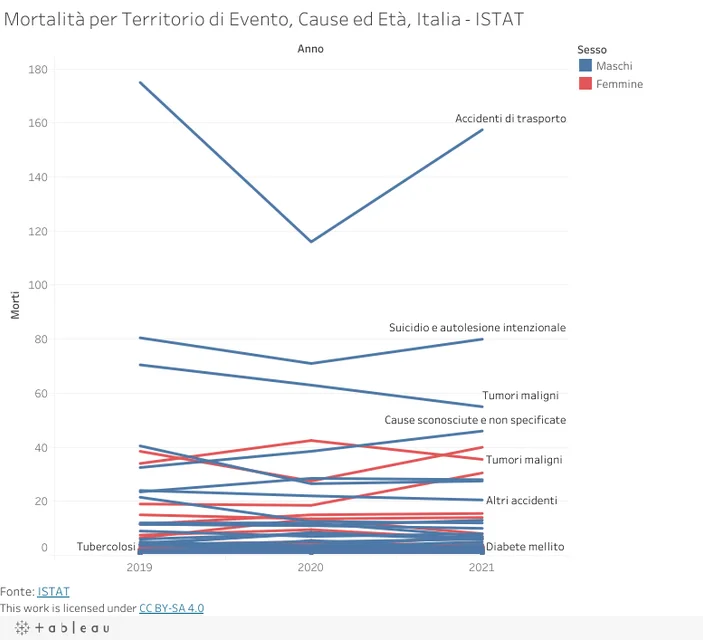 Interactive view
Open original
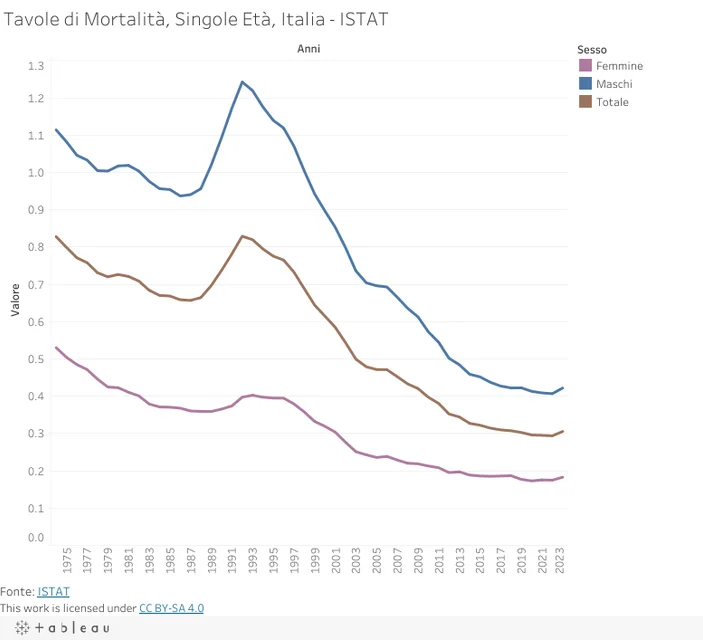 Interactive view
Open original
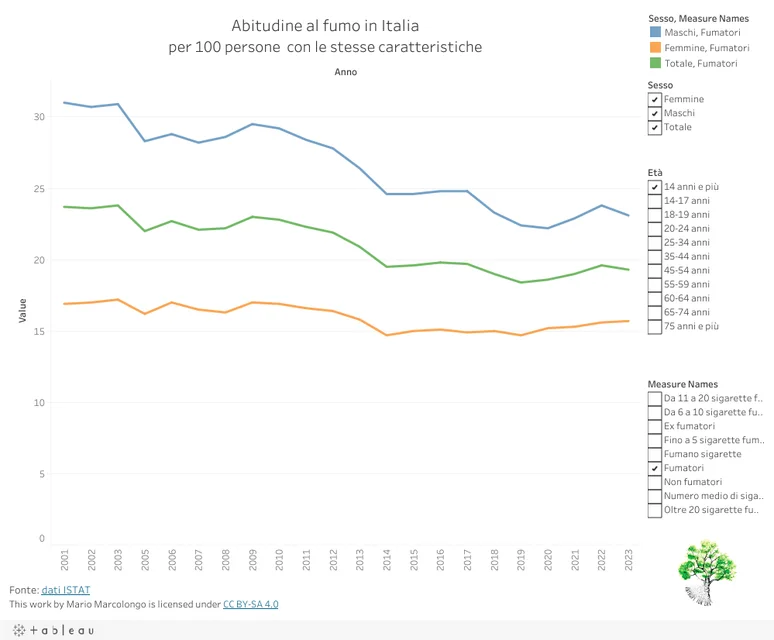 Interactive view
Open original
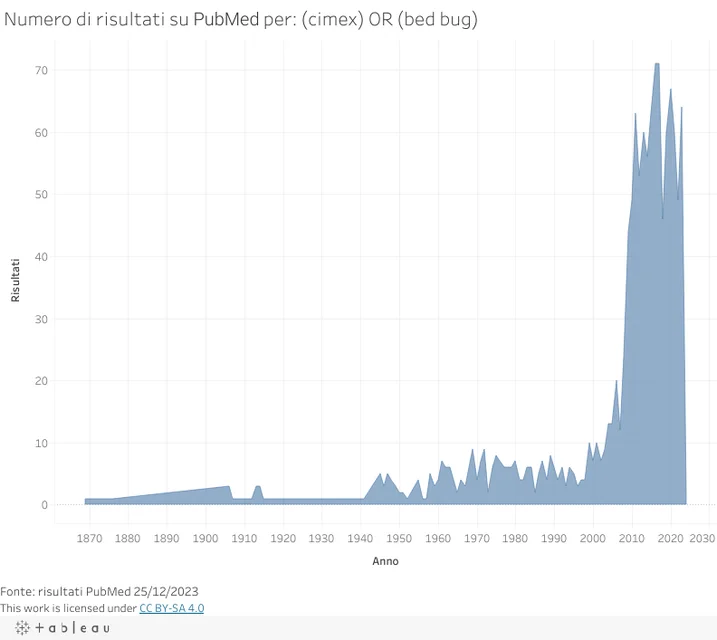 Interactive view
Open original
Diagram / mapOpen original
 Diagram / map
Open original
 Diagram / map
Open original
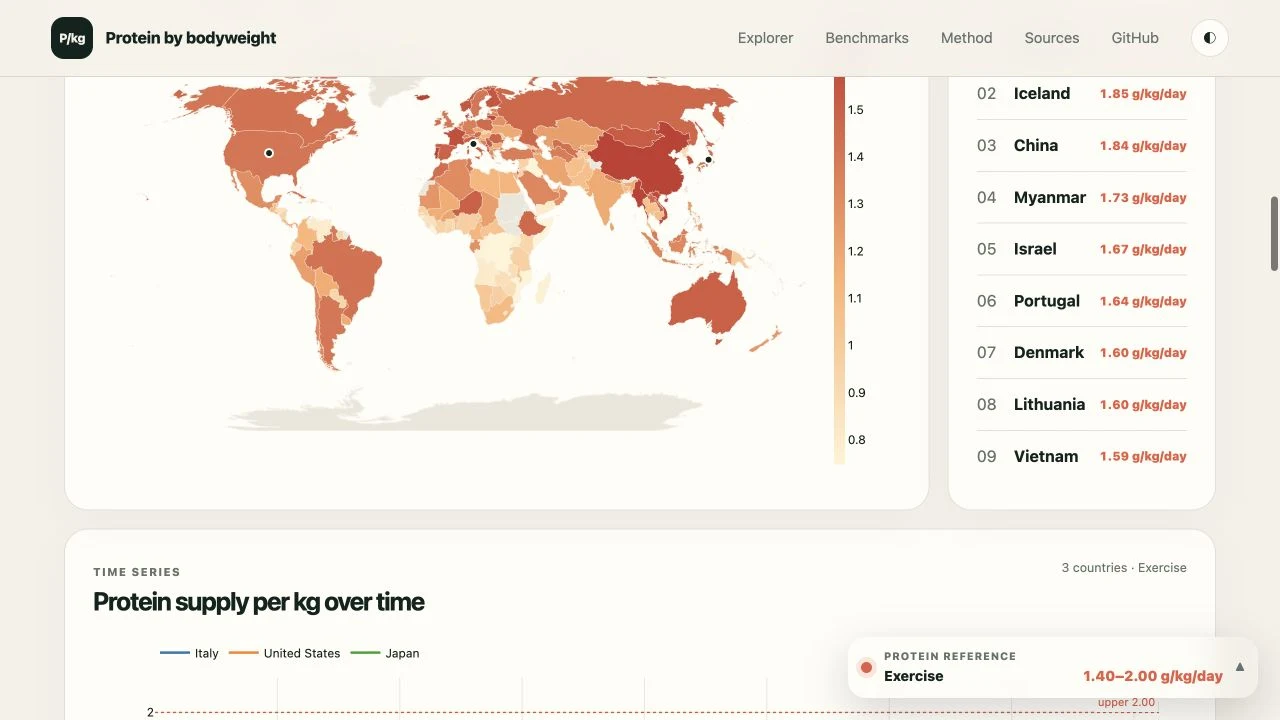 Interactive explorer
Open original
No views match those filters.
Previews are static images of the published work. Open a card for interactive controls, publication dates, source notes and licensing. Entropy for Life projects retain their original branding and attribution.
Collection checked 2026-10-18. These are published artifacts, not a claim about current policy or clinical guidance. Read each view with its dataset, units and source context.